
Visualizing NG9-1-1 Data Attribution Errors Using Fishbone Analysis

For many years, geographIT, a division of EBA Engineering, Inc., has been involved in multiple Next Generation 9-1-1 (NG9-1-1) projects to help counties prepare their GIS data for use in the new NG9-1-1 system. The nationwide NG9-1-1 effort seeks to update and improve the 9-1-1 service infrastructure and public emergency communications services to accommodate wireless mobile technology.
The National Emergency Number Association (NENA) has been developing NG9-1-1 data standards for many years, and these standards are now being incorporated into data models across the country. Organizations can face many challenges when updating their established enterprise GIS data models to comply with the new NENA standards.
For example, during an emergency, incorrect road centerline and address point data can lead to some serious 9-1-1 routing and dispatch errors. Therefore, an important part of our NG9-1-1 work has been identifying and correcting these GIS data errors for our clients.
To help identify road centerline and address point problems in the data, we have used a unique spatial analysis process, known as Fishbone Analysis, to display the errors visually. Fishbone Analysis helps users visually evaluate cause and effect to determine the reason behind certain data issues.
When running the analysis on clean (error-free) address point and road centerline GIS datasets, the resulting visual contains straight lines that do not cross over themselves or cross over the road centerline features. The resulting image looks like fishbones!
Image 1 shows an example of clean data. The mapped location of the address points (green dots) and the location along the road centerline that the address maps to show how the analysis should look when all data is correct.
Image 1:
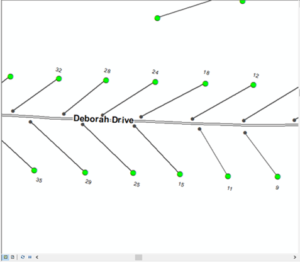
The goal of the analysis is to compare the currently mapped address point with the geocoded address point along the road centerline. Each set of points for an address should be close to each other. A line is drawn to connect the two points, which gives the final visual aid needed to see where errors exist.
The types of errors that this analysis can help identify include:
- House numbers out of sequential order.
- House numbers on the wrong side of street.
- Addresses on the wrong block.
- Invalid address name parts (directional, street name, street types, etc.).
Image 2 shows an example of an area where errors exist in the GIS data. If the lines cross over each other or over the road centerline, these features need to be investigated further to determine the cause of the error.
Image 2:
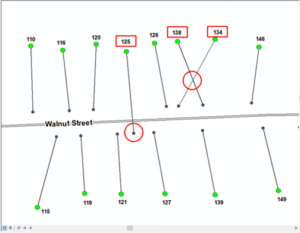
Using this type of analysis and its visual output saves hundreds of hours of work when researching data errors because problem areas are readily apparent. It also provides a powerful visual representation of the issues to share with the local governments, which will help them resolve the errors.
If you’re interested in learning more about this data quality assurance method or the other ways we help local governments get their GIS data and enterprise systems NG9-1-1 ready, please let us know!
David Thaler, GISP, is a senior GIS analyst for geographIT, a division of EBA Engineering, Inc. He can be reached at 717.510.9640, david.thaler@ebaengineering.com, or on LinkedIn.