
Using GIS to Inform and Improve Water Flow Tracking

Water authorities produce millions of gallons of water per day for customers to use through metered accounts, bulk sales to commercial customers, and internal uses like flushing water and wastewater assets. As water is transported through aging equipment, some water is lost due to broken meters or other damage in the distribution system. This is called “non-revenue” water because it is lost before it reaches the customer.
Tracking water flows helps authorities understand how much water is being lost to non-revenue activities, helps with reporting requirements, and can be used to help pinpoint water loss. Using GIS, data managers can go from simply tracking leak locations and associated water usage information to proactively identifying where leaks are occurring.
Using GIS to Track Non-Revenue Water Losses
Using GIS to track non-revenue water losses includes integrating GIS data, such as customer locations or meter locations, with SCADA data detailing the water delivered to a service area, customer meter data, bulk water sales, known leak information, and other water usage activities such as flushing for hydrants, valves, new lines, or wastewater lines. Once the data is integrated in a GIS through database views and automated Python scripts, the authority can analyze water flows and usage in a selected area.
The difference between the water pumped into an area and the water sold to customers is the water being lost or non-revenue water usage. When filtered on a smaller subset of the service area, this information can show the client where losses are occurring and further investigation is needed.
Saving Millions of Gallons for the Hampton Shaler Water Authority
The Hampton Shaler Water Authority (HSWA), located in western Pennsylvania, was losing more than 9 million gallons of water per month in the Etna area when we started tracking non-revenue water loss data. Within 9 months, eight leaks were found in this area; the repaired leaks saved 6 million gallons of water every month.
The authority also conducted a detailed search for leaks in the Sharpsburg area, which was losing 5 million gallons of water each month. Thanks in part to the information shown in the dashboard, a leak was found and repaired that saved almost all of the non-revenue water loss in that area. The Sharpsburg leak was buried 9 feet underground, beneath an abandoned railroad. Because the leak was in an area with sand and gravel alluvial materials, there were no apparent signs of a leak aboveground, and the leak likely would not have been found if the losses weren’t identified in this area.
The GIS data has matched what crews are finding on the ground. Rising water use trends are often quickly followed by field crews hearing noises in the associated area while checking for leaks. As leaks are repaired, the water trends drop, identifying the approximate amount of water that was being lost through the repaired leak(s). This trend information, shared with the foreman and the management team, helps HSWA plan where to send field crews and improves their decision-making process. Ultimately, this data has helped to identify leaks that, once repaired, have saved millions of gallons of water every month for HSWA.
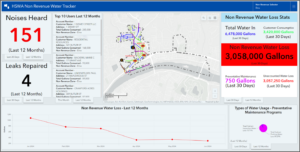
Hampton Shaler Water Authority tracker dashboard showing millions of gallons in non-revenue water loss
Other Benefits of Using GIS
Additional benefits of integrating water flow information in GIS include:
- Easy analysis of customer billing data. Users can investigate active accounts with 0-meter readings and identify top customers for a given period.
- The ability to pull the information into a dashboard and put it in the hands of senior management. Management can perform a quick analysis and filter data to desired areas.
- Generating automated reports from the information to streamline monthly and annual reporting requirements.
In all, GIS integrated with water delivery and usage data provides essential tools to save millions of gallons of water and support informed decisions.
Joe DeLuca, GISP, is a senior vice president and principal-in-charge of EBA’s building information modeling and geospatial technologies departments. He can be reached at 410.979.3548 or joseph.deluca@ebaengineering.com.