ArcGIS Monitor helps troubleshoot performance issues at the Municipal Authority of Westmoreland County

Situated on the eastern side of Pittsburgh, the Municipal Authority of Westmoreland County (MAWC) serves approximately 125,000 water customers and more than 30,000 sewer customers. MAWC manages an extensive network of more than 2,400 miles of water mains, 3 water treatment plants, 650 miles of sewage collection lines, and 11 wastewater treatment plants. Its service area spans 5 counties and 75 municipalities and encompasses numerous pressure zones, reflecting the region’s hilly terrain. Over the past 7 years, MAWC has adopted ArcGIS Enterprise, Geographic Information System (GIS) applications and automated processes to streamline workflows and enhance data analysis and communication capabilities. Their GIS enterprise environment has expanded to include more than 300 named users and more than 50 distinct GIS applications.
MAWC’s GIS environment comprises 12 servers across development and production sites, integrating multiple datasets and supporting more than 300 services. This complex infrastructure occasionally experiences performance issues or downtime caused by various problems, from server-related problems to connectivity issues. The GIS team recognized the need for deeper insights into system performance to troubleshoot issues effectively and establish key performance indicators (KPI) for monitoring and improving the environment over time.
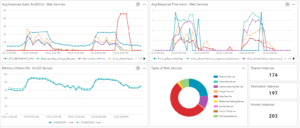
To tackle these challenges, EBA Engineering, Inc. (EBA), an Esri partner, implemented Esri’s ArcGIS Monitor software, a robust tool designed to evaluate the health and performance of enterprise GIS systems. ArcGIS Monitor has become indispensable in troubleshooting issues, enabling the GIS team to swiftly diagnose and resolve issues without immediate IT intervention. During outages or slow response times, the team leverages ArcGIS Monitor alongside ArcGIS Server error logs to diagnose issues. User-friendly graphs and charts, tailored to MAWC’s needs, help staff pinpoint root causes and devise effective solutions, reducing downtime and enhancing system performance. Automated notifications are also configured to proactively alert staff, minimizing disruptions for end users.
Implementing ArcGIS Monitor provided the GIS team with a deeper understanding of MAWC’s server environment, significantly reducing downtime caused by server and performance issues. “ArcGIS Monitor has allowed us to troubleshoot real-time issues in our GIS environment, while giving us the tools necessary to enhance the overall GIS experience for our users and limit slowdowns,” said Anthony Pologruto, GIS Supervisor at MAWC.
A notable example occurred in late 2024, when MAWC experienced response time issues with their GIS services. With KPIs in place to track CPU and memory use, the team leveraged ArcGIS Monitor to quickly identify memory issues on the ArcGIS servers.
The GIS team used metrics from ArcGIS Monitor for each map/feature service in the organization, configuring thresholds to determine which services were higher usage and lower usage. The team then optimized memory allocation by transitioning approximately 200 lower usage maps and feature services from dedicated instance pools to shared instance pools. This adjustment reduced server memory usage by approximately 20% and resolved the performance and memory issues affecting the system.
Items currently being monitored by MAWC in both the production and development environments include:
- ArcGIS Server
- ArcGIS GeoEvent Server
- Enterprise portal
Metrics being tracked include:
- Active users
- GeoEvent events
- Instance types
- Response time
- Server memory
- Web service instance type
- Web service requests
ArcGIS Monitor has proven to be an invaluable tool that can be quickly configured for any environment. Since it is included in most enterprise agreements with Esri, we strongly recommend implementing ArcGIS Monitor in all GIS environments for better insights and analysis to improve system performance.


